

Technical traders are trying to incorporate statistics into their trading. After all, the trading edge based on technical analysis depends on probability. However, many attempts to do so often prove futile. One concept from statistics that shows some promise and is actually used by many traders is linear regression. This strategy shows an example of an indicator that uses linear regression to help traders understand price charts.
i-regression indicator
The i-Regression indicator is a custom technical indicator based on a statistical concept called linear regression. Such use of linear regression allows traders to more easily identify price channels.
This indicator was developed to automatically identify price channels using linear regression as a basis for plotting the range of channels. This is done using the concept of a bell curve. Then, identify the average price based on the distribution of prices. The next step that algorithm takes is to use the standard deviation to calculate the limits outside the range such that a certain percentage of price points fall within the range. For example, a standard deviation of 2 indicates that approximately 95% of price data points fall within the channel.
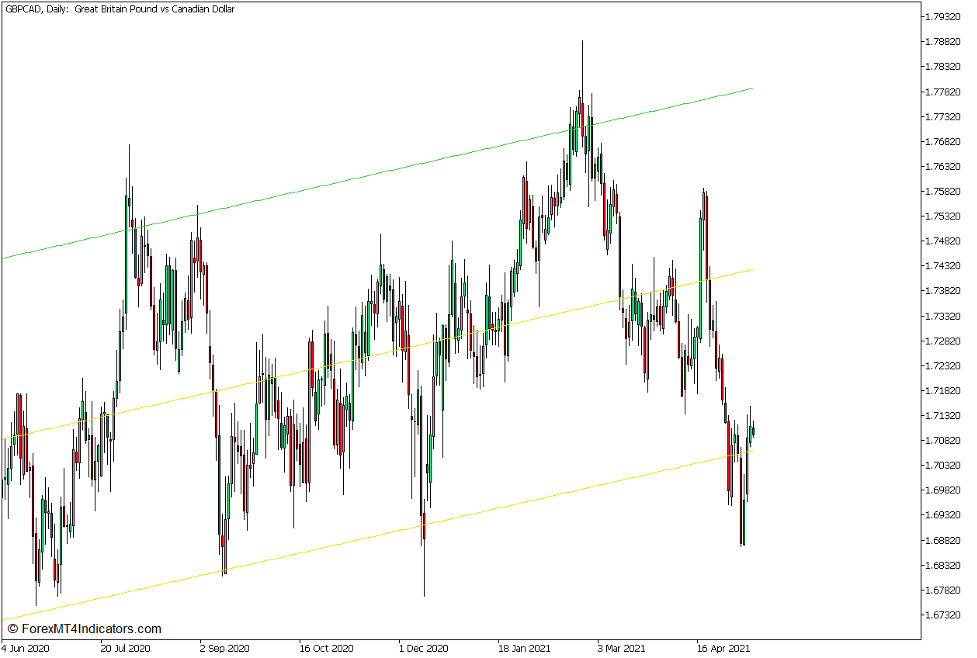
The i-Regression indicator has three settings that change how the indicator plots the channels. The first type of channel to plot is the basic linear regression channel. Plot three straight lines. The middle line represents the average or median price of the range. The upper and lower lines represent the upper and lower price ranges that allow the indicator to cover approximately 95% of the price points within the price channel.
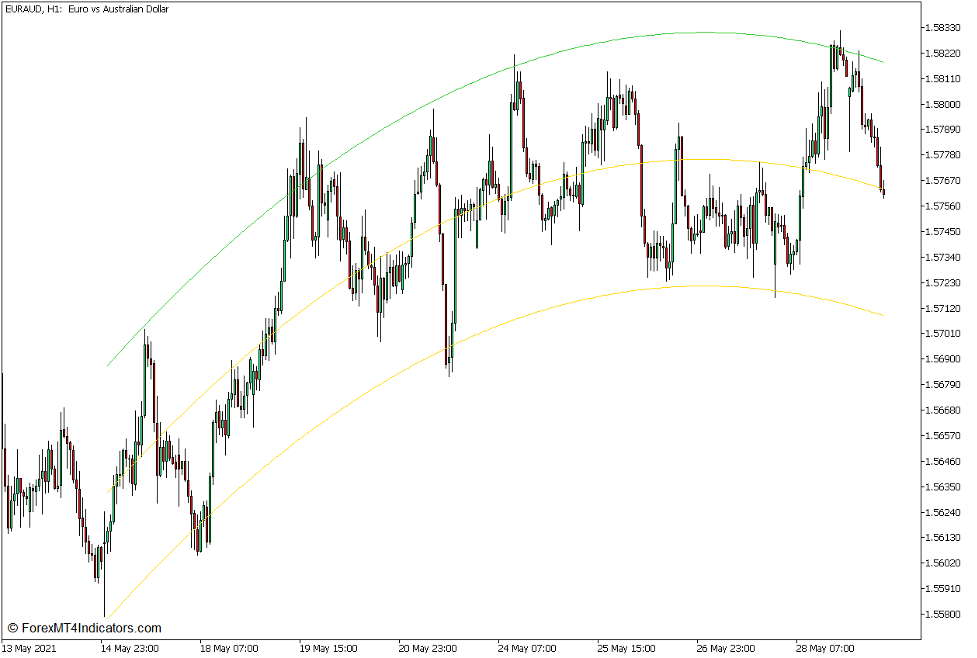
The next type of channel to plot is a parabolic type channel. It uses a formula that plots the channel the indicator bends once. This allows users to easily identify changes in the trajectory of price action.
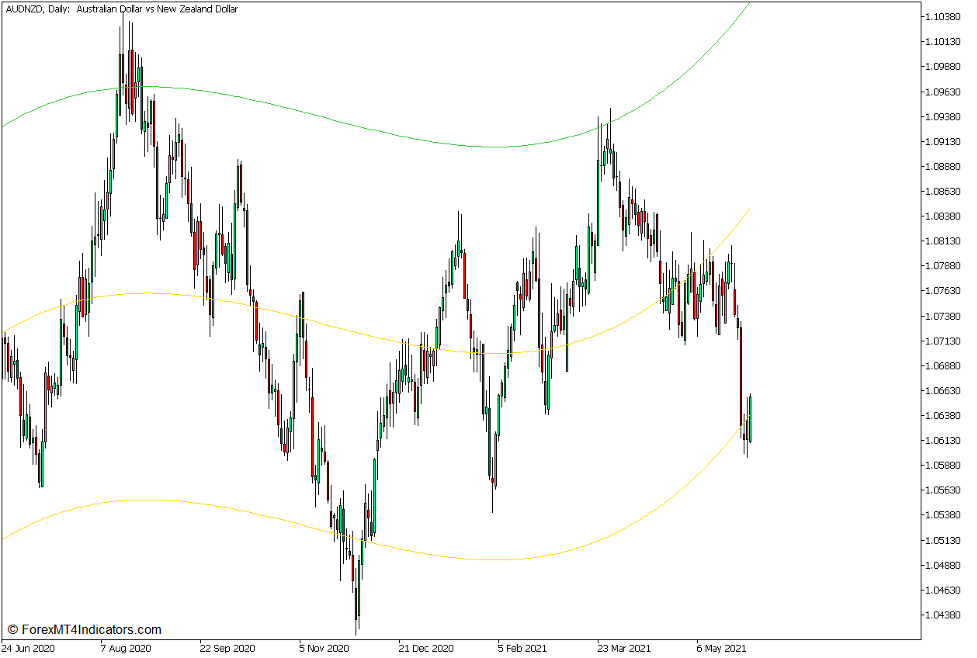
The last type of channel that this indicator plots is the one that uses the cubic formula. This allows the indicator to plot her two-point bend channel. This allows us to more accurately identify the trajectory of price action.
Pinbar Candles and Price Rejection
Candlestick patterns are probably one of the most graphic and immediate signals a trader can use. This is because candlestick patterns tell a story that tells the direction of the market. In particular, a candlestick reversal pattern is a sign of a possible price refusal and momentum reversal.
The pinbar pattern is one of the most basic and effective momentum reversal candlestick patterns used by traders. A simple candlestick pattern consisting of only one candlestick. It is identified as a candle with a very small body with a long wick on one end and a smaller wick on the opposite end. Its orientation may be identified based on where the long core is relative to its body. A candle is identified as a bullish pinbar candle if the long wick is below the body. On the other hand, if the long wick is above the body, the candle signals a possible bearish reversal.
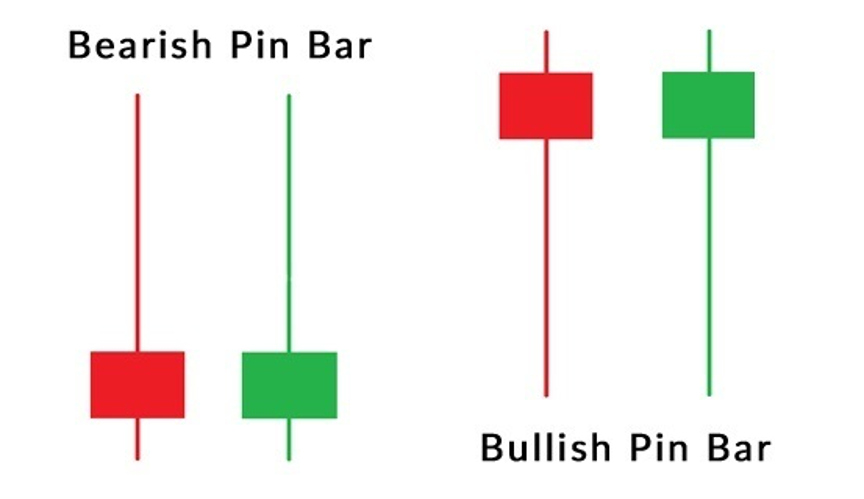
A pinbar pattern is a sign of a possible momentum reversal as it tells a story of price rejection. This shows that the market is uncomfortable with a certain price level and will quickly reject it. So the market recovers quickly against highs or lows and closes near the opposite end, creating a candle with a long wick. and small body.
trading strategy concept
The i-Regression Parabolic Median Break Forex Trading Strategy For MT5 is a simple channel-based trading strategy that provides trading signals when the price exceeds the channel average. Use the i-Regression Indicator to help traders identify price channels objectively. In particular, it uses parabolic channels. This allows you to observe the direction of price action and the trend trajectory.
The first criterion to be met is a strong crossover between the price and the midline of the parabolic i-Regression channel. This indicates a shift in the direction of momentum. However, we do not trade solely based on the crossover between the price and the channel median. Allow the price to pull back towards the middle line. Then observe the signs of price refusal in the area around the central line. This is identified by a pin bar candle pushing against the centerline of the channel.
Trading setup
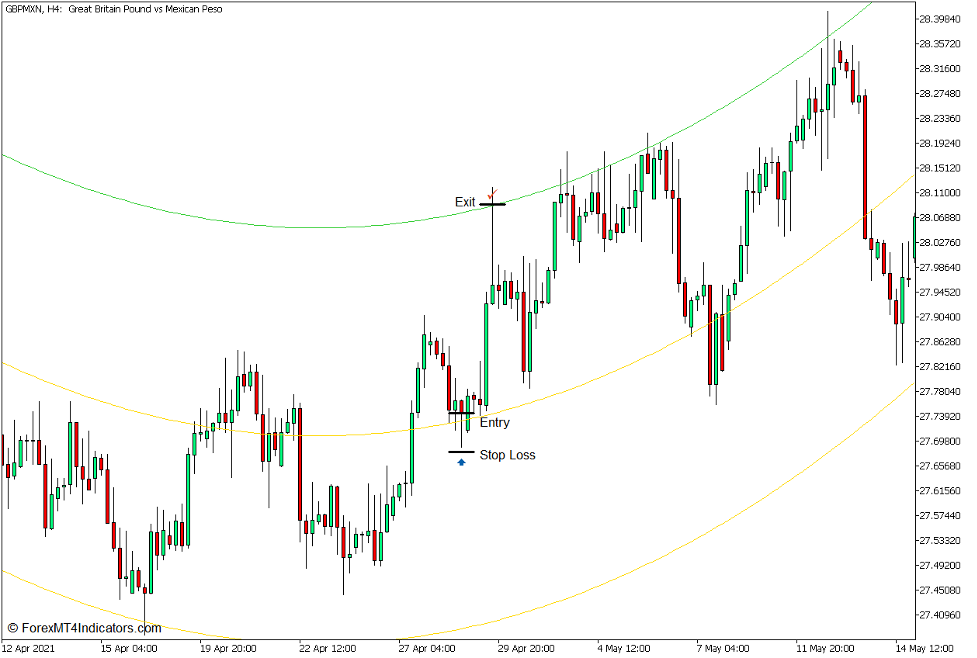
entry
- The price should cross the midline of the i-Regression channel with strong momentum.
- Allow the price to pull back towards the center line of the channel.
- Open a buy order as soon as a bullish pin bar candle indicating price rejection in the area is identified.
stop loss
- Place a stop loss below the entry candlestick.
Exit
- Close the trade as soon as the price hits the i-Regression channel limit.
sell trade settings
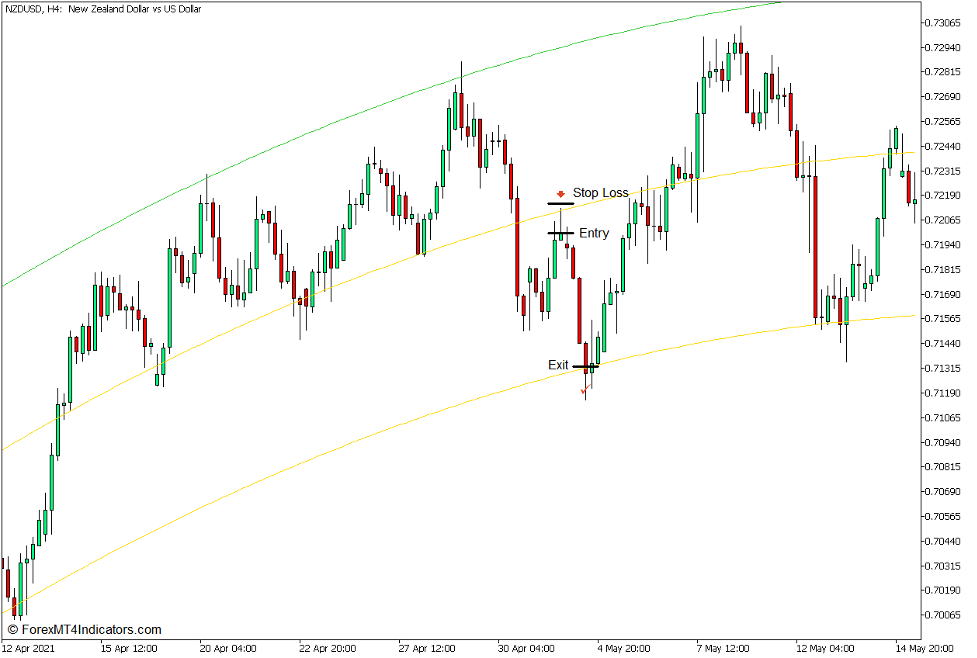
entry
- The price must break below the i-Regression channel midline with strong momentum.
- Allow the price to pull back towards the center line of the channel.
- Open a sell order as soon as a bearish pinbar candle indicating price rejection in the area is identified.
stop loss
- Set your stop loss above the entry candle.
Exit
- Close the trade as soon as the price touches the lower line of the i-Regression channel.
Conclusion
Channel-based trading is one of the most basic trading strategies available to traders. Most traders do this by plotting trend lines based on price action. However, this method can be subjective. On the other hand, the above strategy allows traders to objectively identify channels using the i-Regression Indicator.
One variation of this strategy is to trade a price refusal formed at either the upper or lower limits of the channel. This may allow for higher yields based on risk and reward.
Traders using this strategy need to learn to read price action, as price action is the fundamental basis of trading signals.
Forex Trading Strategy Installation Instructions
The i-Regression Parabolic Median Break Forex Trading Strategy for MT5 is a combination of Metatrader 5 (MT5) indicator and template.
The essence of this forex strategy is to convert accumulated historical data and trading signals.
i-Regression Parabolic Median Break Forex Trading Strategy For MT5 provides for an opportunity to detect various peculiarities and patterns in price dynamics which are invisible to the naked eye.
Based on this information, traders can anticipate further price movements and adjust this strategy accordingly.