

Trending markets can provide excellent trading opportunities as you can easily identify the direction the market is moving. Traders simply identify the trend direction and trade in that direction. After that, traders need to identify the entry level they want to start trading. Pullbacks are a great option as they allow traders to enter the trending market at near optimal price levels. This trading strategy shows how to use the RSI of MACD Double indicator to trade pullbacks in trending markets.
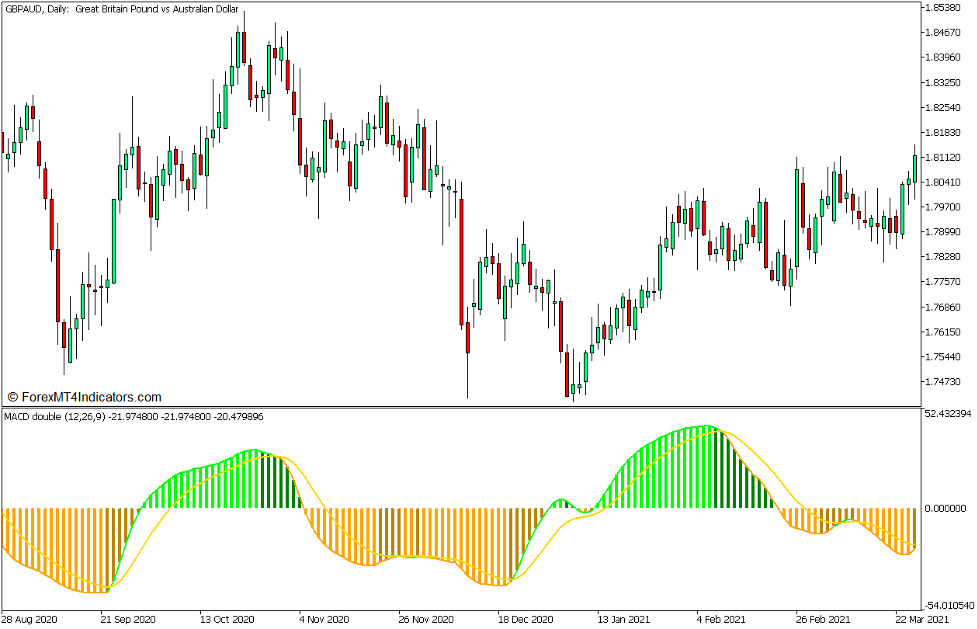
RSI for MACD double indicator
RSI for MACD Double Indicator is a custom indicator derived from Relative Strength Index (RSI) and Moving Average Convergence Divergence (MACD).
The RSI is a classic oscillator type indicator that helps traders identify the direction of momentum. It measures market momentum by calculating the magnitude of recent price movements. It can also be used to identify overbought and oversold markets based on the oscillator line reaching the upper or lower end of the range.
On the other hand, MACD is also a momentum indicator that shows trend direction by calculating the difference between two exponential moving averages (EMAs). The difference between two underlying EMA lines is used to plot MACD lines or histogram bars. It also calculates Simple Moving Average (SMA) of MACD lines. The result is plotted as a signal line that follows the movement of the main his MACD line.
The RSI for MACD double indicator is a modified version of the MACD. Instead of using the underlying closing price of each bar, this indicator uses the underlying RSI calculation to calculate the MACD line. In a sense, it is the MACD derived from the RSI. Calculate two EMA lines based on the RSI and use the results to plot the MACD line. Like normal MACD, we also calculate the SMA of the MACD line, which is the signal line.
It also plots the histogram bars along with the MACD line. These histogram bars change color depending on whether the bar is positive or negative and whether the value is rising or falling. Lime bars indicate positive bars with increasing values, green bars indicate positive bars with decreasing values. On the other hand, orange bars indicate negative bars with decreasing values and goldenrod bars indicate negative bars with increasing values.
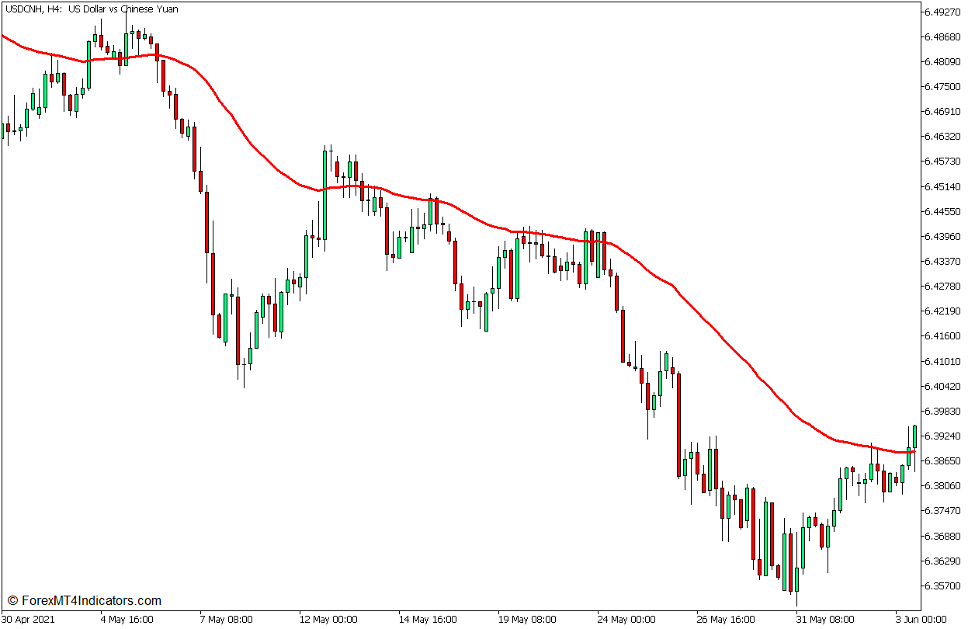
50 Exponential Moving Average
Most moving averages tend to be too slow, making it a little too late for traders to make trading decisions.
An exponential moving average (EMA) is a type of moving average that puts more weight on more recent price data than on earlier historical price data. By doing so, the EMA creates a moving average with less lag compared to the basic moving average, making it more sensitive to trend and momentum reversals and oscillations, while maintaining its smoothness.
The 50 bar EMA line is widely used as a mid-term moving average line. Traders often identify the general trend direction based on the general position of price action relative to the 50 EMA line. It also means that trend direction can be identified based on the slope of the 50 EMA line.
The 50 EMA line can also be used as a dynamic area of support or resistance. Traders can use the area around the 50 EMA line as a support area during an uptrend and as a resistance area during a downtrend.
trading strategy concept
The RSI for MACD Double Trend Swing Forex Trading Strategy for MT5 is a trend continuation strategy that trades along trending markets that oscillate up and down the price chart. Attempt a trade at the end of a large market pullback, which is commonly observed as a market volatility.
The 50 EMA line is mainly used as a trend direction filter. This is based on the general position of price action relative to the 50 EMA line and the slope of the line.
It is also used as a dynamic area of support or resistance. The area around the 50 EMA line is likely to see a trending market pullback and a pullback from there.
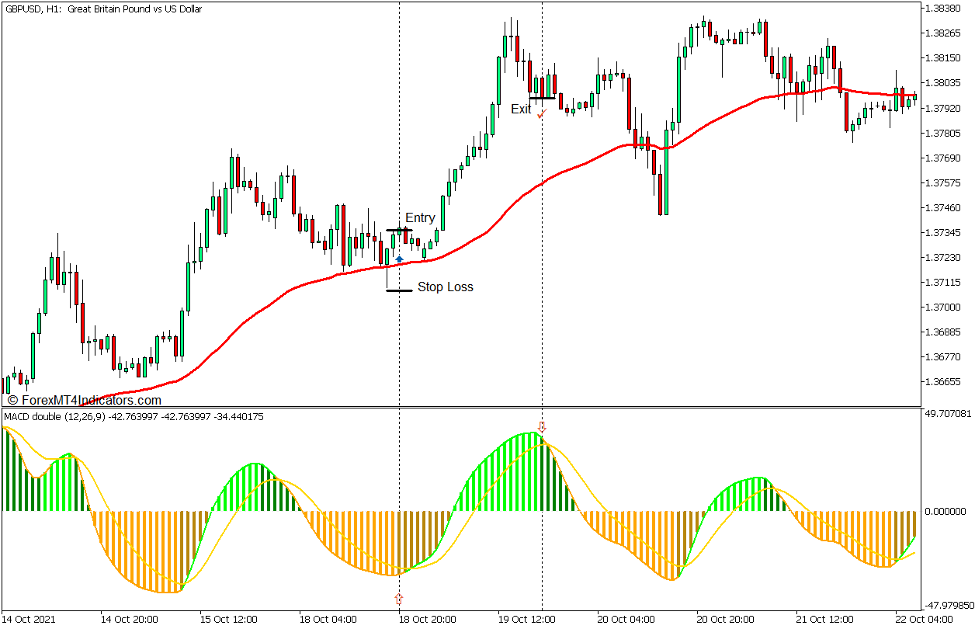
The RSI of the MACD double indicator is used as a trade entry signal that should converge with the trend direction based on the 50 EMA. Trade entry signals are based on color changes of plotted histogram bars.
Trading setup
entry
- The 50 EMA line should move up while price action is generally above the 50 EMA line.
- Let the price pull back towards the 50 EMA line.
- Place a buy order as soon as the RSI on the MACD double histogram bars turns into a golden rod indicating a reversal of bullish momentum.
stop loss
- Place your stop loss on the fractal below the entry candle.
Exit
- Close the trade as soon as the MACD double bars RSI turns green indicating a possible reversal of the bearish momentum.
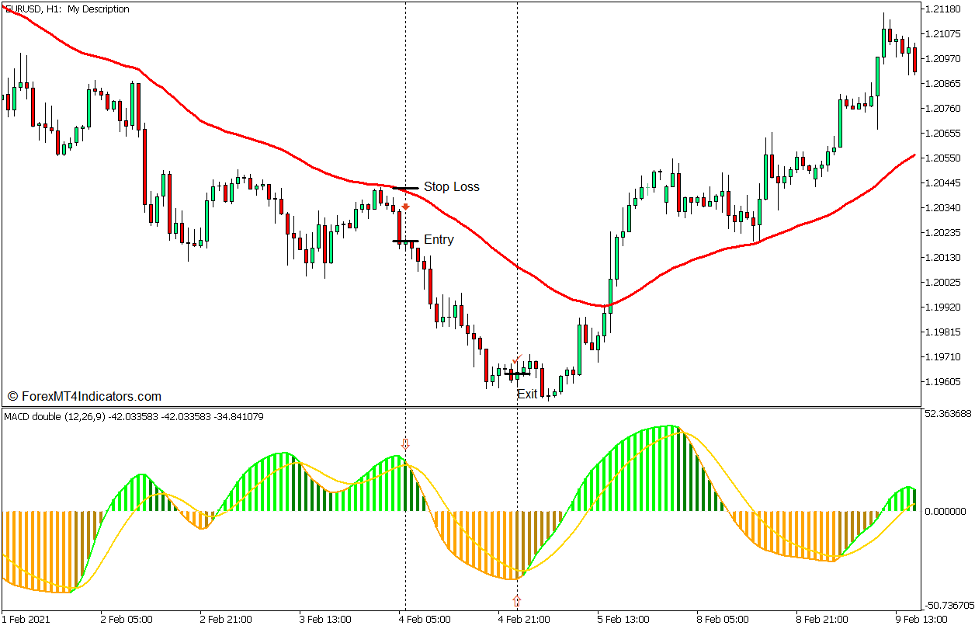
sell trade settings
entry
- While price action is generally below the 50 EMA line, the 50 EMA line should move down.
- Let the price pull back towards the 50 EMA line.
- Place a sell order as soon as the RSI on the MACD double histogram bars turns green indicating a bearish momentum reversal.
stop loss
- Set a stop loss on the fractal above the entry candle.
Exit
- Close the trade as soon as the RSI on the MACD double bar turns into a golden rod, indicating a possible reversal of bullish momentum.
Conclusion
This trading strategy is a good way to trade with the trend as it allows traders to trade with pullbacks. However, the color change of the bars may still lag a bit, which is common in many indicators. Traders can adjust variables within the indicator settings to make the indicator more sensitive to price changes and further reduce lag.
Forex Trading Strategy Installation Instructions
The RSI for MACD Double Trend Swing Forex Trading Strategy for MT5 is a combination of MetaTrader 5 (MT5) indicator and template.
The essence of this forex strategy is to convert accumulated historical data and trading signals.
RSI For MACD Double Trend Swing Forex Trading Strategy For MT5 provides an opportunity to detect various peculiarities and patterns in price dynamics which are invisible to the naked eye.
Based on this information, traders can anticipate further price movements and adjust this strategy accordingly.
Recommended Forex MetaTrader 5 Trading Platform
#1 – XM Market
- Free $50 To start trading immediately! (withdrawable profit)
- Deposit bonus up to $5,000
- Unlimited Loyalty Program
- Award Winning Forex Broker
- Additional Exclusive Bonus throughout the year

>> Claim your $50 bonus here <
Click here for a step-by-step XM broker account opening guide.
#2 – Pocket Options
- Free +50% bonus to start trading instantly
- 9.6 Overall Rating!
- Automatically credited to your account
- no hidden terms
- Accept US Residents

How to install RSI for MACD Double Trend Swing Forex Trading Strategy for MT5?
- Download MACD Double Trend Swing Forex Trading Strategy RSI for MT5.zip
- Copy the *mq5 and ex5 files to the metatrader directory /experts/indicators/.
- Copy the tpl file (template) to the Metatrader directory /templates/.
- Start or restart your Metatrader client
- Choose a chart and timeframe to test your forex strategy
- Right click on the trading chart and hover over “Templates”
- Move right to select RSI For MACD Double Trend Swing Forex Trading Strategy For MT5
- You can see RSI for MACD Double Trend Swing Forex Trading Strategy for MT5 is available on chart
*Note: Not all forex strategies come with mq5/ex5 files. Some templates are already integrated with his MT5 indicator on the MetaTrader platform.
Click below to download.
Get download access